November 15, 2012

微軟:數據科學家 會紅

微軟:數據科學家 會紅

news.chinatimes.com | Nov 30th -0001

 微軟全球資深副總裁兼亞太研發集團主席張亞勤昨(6)日在華人企業領袖高峰會時表示,雲端時代的殺手級應用是海量資料(Big Data),他表示,年輕人如果不知道該找什麼工作,不妨考慮投入資料分析、成為資料數據科學家,這將是未來相當具有潛力的工作。

 張亞勤表示,個人電腦時代的殺手級應用是Office文書處理軟體,在個人電腦為主要工作平台的時代,企業講求的是商業智慧分析(BI)需求,但現在是雲端時代,殺手級應用為海量資料分析。

 微軟針對雲端時代已經推出了公有雲Azure的服務,這個平台現在的運算能量,已經超過1999年微軟運算量的總和。而過去6估月內,該平台資料量已經是倍數成長,而近兩個月儲存量也成長了1倍。而Azure推出迄今僅3年。該平台也在不久前落地大陸。

 張亞勤預估,到了2015年時,雲端運算將在全球帶來1,400萬的工作機會,而其他大型企業也預估到了2014年時,約有5成的運算將是透過雲端運算的方式產生。而目前所有的數據,有9成是過去兩年中形成的。更值得一提的是,世界經濟論壇將海量資料視為新的資源及貨幣。可見未來雲端運算普及之後,海量資料將成為顯學。

 針對這個大趨勢,也會帶動及催生所謂的資料分析專家的需求,張亞勤表示,透過資料的分析及探勘,海量數據將可望產生意想不到的「價值」,這將是未來商機所在。

 由於近期全球均遭逢不景氣,昨日的華人企業領袖高峰會的與會者,也針對年輕人創業等議題提出建議,張亞勤認為,海量資料所帶動的資料分析及資料探勘科學家,將是極具有未來性的工作趨勢。

Original Page: http://news.chinatimes.com/tech/171706/122012110700414.html

Shared from Pocket

Best, 

Frank

November 04, 2012

R in the Press

R in the Press

by Pairach, r-bloggers.com
November 1st 2012

(This article was first published on Pairach Piboonrungroj » R, and kindly contributed to R-bloggers)

Here is the list of press reports and news about R

  1. Bits (A bog under The New York Times)
    R you ready for R?
    by Ashlee Vance
    Published: January 8, 2009, 1:52 PM
  2. The New York Times
    Data Analysts Captivated by R’s Power
    by Ashlee Vance
    Published: January 6, 2009
  3.  InfoWorld
    The BI battle isn’t between IBM and SAS
    The little known open source project R may be the disruptor in this billion-dollar market
    By Zack Urlocker
    Published: December 2nd, 2009
  4. TechCrunch
    Big Data Right Now: Five Trendy Open Source Technologies
    by Tim Gasper
    Published: Saturday, October 27th, 2012

Filed under: R To leave a comment for the author, please follow the link and comment on his blog: Pairach Piboonrungroj » R.
R-bloggers.com offers daily e-mail updates about R news and tutorials on topics such as: visualization (ggplot2, Boxplots, maps, animation), programming (RStudio, Sweave, LaTeX, SQL, Eclipse, git, hadoop, Web Scraping) statistics (regression, PCA, time series,ecdf, trading) and more...

June 01, 2012

The Popularity of Data Analysis Software

開放原始碼的R語言在資料分析上的知名度及使用率近年已經大幅增加。以下只截取報告中最重要的部份。全文請見:http://r4stats.com/articles/popularity/


Surveys of Use

One way to estimate the relative popularity of data analysis software is though a survey. Rexer Analytics does a survey each year asking about tools used for data mining. The difference between software for classical data analysis software and data mining seems like more of a marketing concept than one based on any actual difference in analytic need. Figure 3 shows the results of just one “check all that apply” type question about the tools that respondents reported using in 2009 (the survey was taken in 2010).

Figure 3. Data mining/analytic tools reported in use on Rexer Analytics survey during 2009.

We see that R comes out on top, followed by SAS and SPSS. The entire report contained over 40 questions on topics such as algorithms used, fields, challenges, data, impact of the economy on the field, and more. More comprehensive results are available here. It’s interesting to note that SPSS and SAS are used more often than their more expensive products aimed specifically at data mining, SPSS IBM Modeler (formerly Clementine) and SAS Enterprise Miner. This data is two years old now and due to be updated soon.

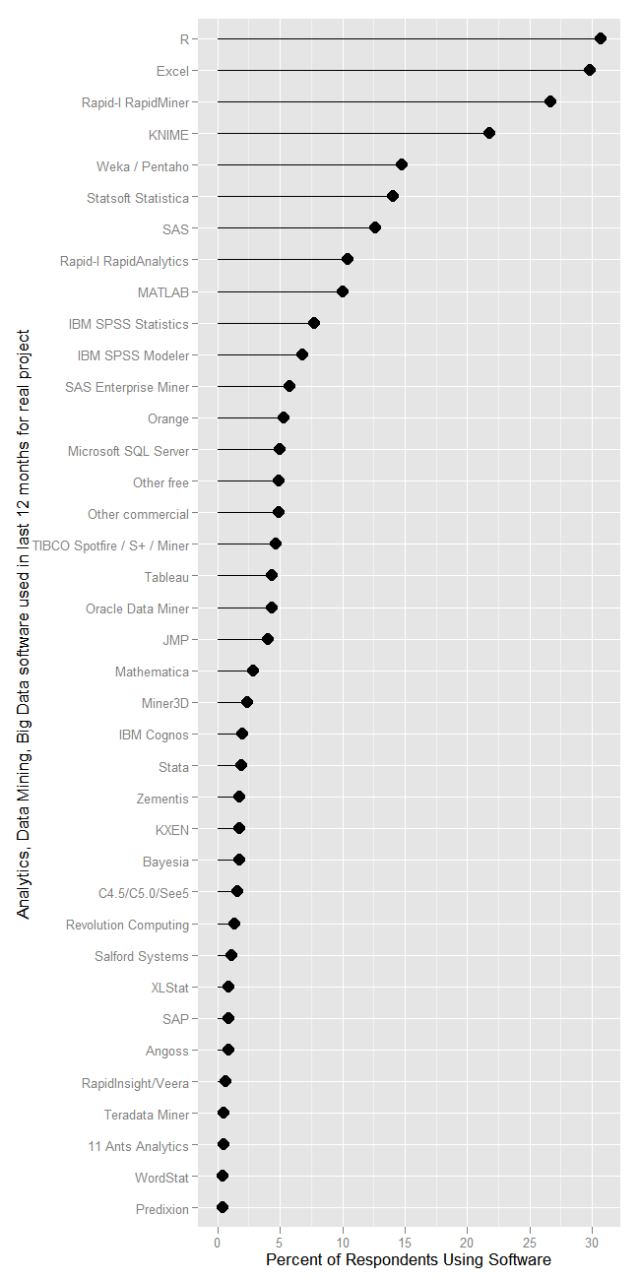
The results of a similar survey done by the data mining web site KDnuggets in 2012 are shown in Figure 4. This one shows R in first place with 30.7% of users reporting having used it for a real project. Excel is almost as popular. It seems out of place among so many more capable packages, but Excel is a tool that almost everyone has and knows how to use.

It’s interesting to note that four of the top five packages used were open source. While open source packages are clearly playing a major role in analytics, people still reported using more commercial software (1086) than open source (927).


Figure 4. Percent of KDnuggets survey respondents that reported using software for analytics, data mining or big data project for 12 months prior to May 2012.

May 08, 2012

Cite in Lyx using Firefox + Zotero + Lyz

I have been using Lyx to mantain my CV. Knowig little about LaTeX and being lazy to learn LaTeX, I have been seeing Lyz as a friendly document editor on my desktop.

Then I learned how to use Zotero in 2010 and completed the migration from JabRef to Zotero.

Today I am using Lyz, a Firefox add-on that supplements Zotero to cite references in a Lyx document. Wonderful result. 

Here are the steps of how to get it done. Make sure you already are familiar with Lyx and Zotero and have installed Lyz in your Firefox. 

First, get basic setings done:

copy the pipe setting in Lyx and paste it to the setting of Lyz.

Step 2: select references you want to import to Lyx

Right click on the entries and click on "cite in Lyx". Suppose you like to put your citations in a separate bib file, say, test.bib, then let's create it.

Step 3: Insert the bib file into your Lyx document

Step 4: Insert references

Now you can insert references by right click on the entries selected in Zotero and see them show up in Lyx.

Here is the result:

May 02, 2012

Information Age: graduates driving industry adoption of R

Revolutions

Information Age recently published a feature article devoted to the R language, "Putting the R in analytics". Says author Pete Swabey:

Already popular in universities, there are signs that R is finding increasing adoption in the enterprise. This promises to lower the barriers of entry for advanced analytics, and may accelerate the mathemitisation of business management.

The article includes an overview of the history of R: its predecessor, the S language; the transition to open-source R; the pervasiveness of R in academia; and how this is driving an increasing rate of adoption in industry.

This popularity in academia means that R is being taught to statistics students, says Matthew Aldridge, co-founder of UK- based data analysis consultancy Mango Solutions. “We're seeing a lot of academic departments using R, versus SPSS which was what they always used to teach at university,” he says. “That means a lot of students are coming out with R skills.”

Finance and accounting advisory Deloitte, which uses R for various statistical analyses and to visualise data for presentations, has found this to be the case. “Many of the analytical hires coming out of school now have more experience with R than with SAS and SPSS, which was not the case years ago,” says Michael Petrillo, a senior project lead at Deloitte's New York branch.

Like many companies today, Deloitte needs to develop analytics with varied and large quantities of data, and is using Revolution R Enterprise for big-data analytics and API integration of R:

Deloitte is currently preparing a big data pilot using Revolution Analytics’ enhanced R product. “We are using the server-based version of Revolution R to investigate big data analysis capabilities,” says Petrillo.

“We are looking at integration options to [big data programming platform] Hadoop, as well as ability to integrate R code into other applications via a web services framework.”

I'm also quoted in the article discussing the big-data extensions of Revolution R Enterprise:

Smith argues that these enhancements are necessary if R is to be applied to ‘big data’, i.e. data whose volume, velocity and variability outstrip the capabilities of conventional relational databases.

For more on the history of R and its applications in business, read the complete article in Information Age at the link below.

Information Age: Putting the R in Analytics

Sent with Reeder

January 28, 2012

More people want to learn statistics

 
More people want to learn statistics
Published on FlowingData | shared via feedly

Data is hot right now, so as you would expect, more people are signing up and applying to learn about it. Quentin Hardy for The New York Times reports.

At North Carolina State, an advanced analytics program lasting 10 months has, since its founding in 2006, placed over 90 percent of its students annually. The average graduate’s starting salary for an entry-level job is $73,000. Its current class of 40 students had 185 applicants, and next year’s applications are already twice that. In 2009, Harvard awarded four undergraduate degrees in statistics. Two graduates went into finance, one to political polling and one became a substitute teacher. There were nine graduates in 2010, 13 last year. They headed into Google, biosciences and Wall Street, as well as Stanford's literature department.

And in 2011, just about everywhere.

[New York Times via @jsteeleeditor]


January 18, 2012

R is definitely the future (for those who can learn with English).

I had witnessed one of the founders of SAS moved to R in 2003 when I was a graduate student.

Now I am watching that the founder of SPSS moved to R and founded a new company based on R. (take a look of the last page of the pdf and see the intro of the author and the company:
http://www.revolutionanalytics.com/why-revolution-r/whitepapers/The-Rise-of-Big-Data-Executive-Brief.pdf

Here is the slide that may also interest you:
http://www.revolutionanalytics.com/news-events/free-webinars/2011/big-data-analytics/Big-Analytics-Revolution-Starts-with-R.pdf

Using R in academics can become a common language in the coming years. I am glad that I am on this exciting track and believe that you will feel the same.
I am also going to share these progresses with my students in the data analysis course using R next semester.